

Custom D3.js Visualization Development
Custom interactive charts, bespoke visual components, and scalable SVG/Canvas data views tailored for complex data platforms.

100%
100% of our clients claim they’d recommend us to the others.
(And they actually do.)
300+
300+ projects within 10 years.
(Because we’re so fast and efficient.)
90%
90% of our team members are senior-level experts.
(Expect nothing but excellence.)
When standard chart libraries stop being enough
Value & Business Impact
Standard chart libraries often break down when confronted with unique visual logic or dense datasets. We leverage D3.js to write custom data binding and DOM manipulation pipelines that transform complex analytical output into clear, performant graphic interfaces.

Move beyond generic out-of-the-box charts
Build custom visual components designed around your exact data domain rather than shoehorning metrics into standard bar or line templates.

Render large visual datasets without UI degradation
Optimize SVG rendering, Canvas pipelines, and web workers to keep custom visualizations fluid even during heavy data interaction.

Transform raw ML predictions into readable graphics
Present statistical outputs, probability distributions, and multi-variable projections in clear visual formats that non-technical users can evaluate.
D3.js works especially well when visualization is part of the product itself — not a static reporting layer. We build interactions and visual behaviors directly around the workflows your users need.
Embed interactive visual tooling into existing Web Apps
Integrate lightweight D3.js modules seamlessly into modern frontend stacks like React, Vue, or Angular without breaking client-side state management.
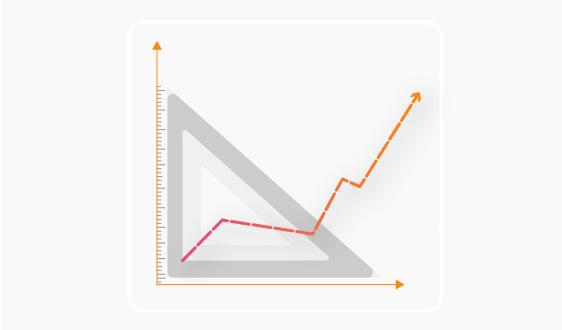
Enable granular visual drill-downs for operational teams
Develop custom tooltips, dynamic overlays, cross-filtering, and zoom controls so analysts can transition instantly from global trends to precise metrics.
Accelerate product validation with targeted visual prototypes
Rapidly prototype bespoke visualization mechanics to test stakeholder adoption and prove data utility early in the design cycle.
Featured Case Study
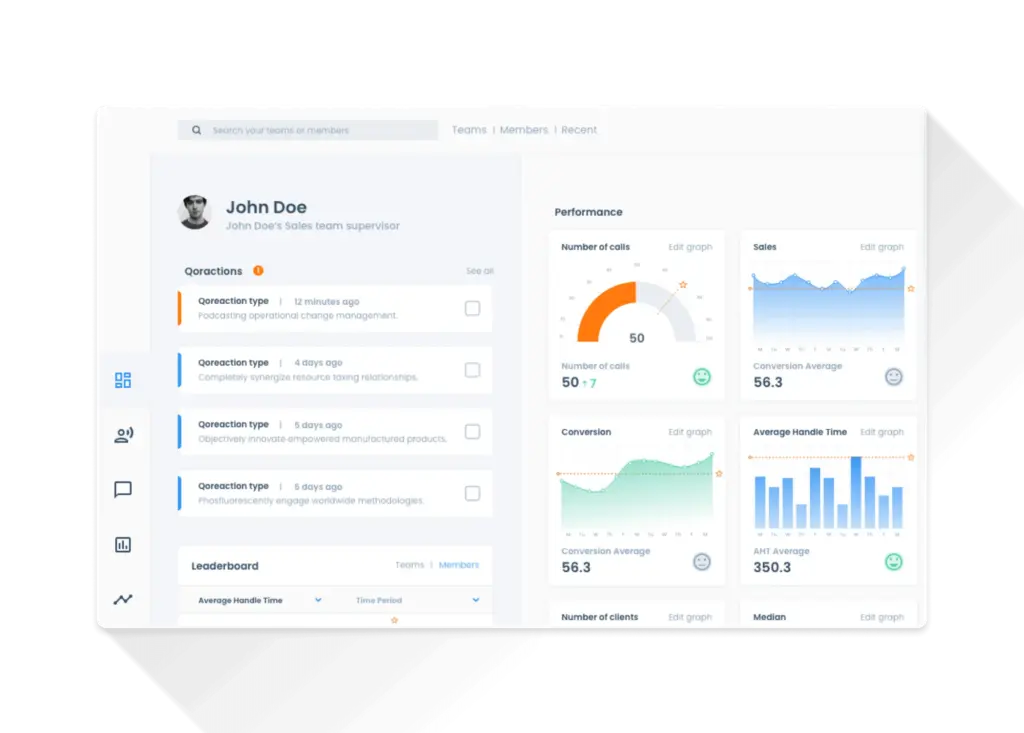

Need a visualization standard chart libraries cannot express?
We can prototype the interaction first, validate it with real data, and then turn it into a reusable production component.
Our D3.js Development Process
We start from the data and user interaction model, then validate the visual concept before committing to production implementation. The goal is to prove readability, interaction, and rendering performance early.
01
Workshops
Analyzing raw data schemas, required user interactions, visual complexity, and integration constraints within your platform.
02
Kick-off & Data Mapping
Defining layout functions and confirming performance targets.
03
Visual Concepts & Prototyping
Creating wireframes and early visual proofs to validate visual hierarchy, scale representations, and user interaction modes.
04
D3.js Implementation & Integration
Developing custom scale handlers, transition logic, and event listeners while keeping frontend component lifecycle clean.
05
Performance & Data Edge-Case Validation
Stress testing layouts with sparse, corrupted, or high-frequency streaming data to ensure rendering stability under load.
06
Code Handover & Component Modularization
Delivering modularized, fully documented D3 components.
Our Tools & Methods
Custom data graphic engineering using open-source, flexible toolsets

Visualization
core
D3.js / SVG


High-volume rendering
Canvas / Web Workers


Frontend integration
TypeScript / React / Vue.js


Interaction
layer
DOM / Events / Transitions


What you get from a D3.js development engagement
Custom Visualization Components, Data Transformation Utilities, Layout Generators, Interactive Prototypes, and modularized D3.js code prepared for integration and continued development.
Frequently asked questions about D3.js development
When should I use D3.js instead of a standard chart library?
D3.js is a strong fit when the visualization has custom interaction rules, non-standard layouts, domain-specific visual logic, or needs to behave like a product feature rather than a generic chart. If standard bars, lines, or dashboards already cover the requirement, a simpler chart library may be more efficient.
Can D3.js handle large or frequently changing datasets?
Yes, but the rendering strategy matters. We can combine D3.js data logic with SVG, Canvas, web workers, and selective updates to keep interactions responsive under heavier visual workloads.
Can D3.js be integrated with React or Vue?
Yes. We structure D3.js modules so visualization state and DOM updates do not conflict with the frontend component lifecycle. The exact integration pattern depends on how much of the rendering and interaction logic should be owned by D3.js versus the application framework.
Can D3.js visualize Machine Learning outputs?
Yes. Statistical results, probabilities, model outputs, projections, and multi-variable data can be transformed into visual interfaces that help non-technical users interpret the underlying analytical result.
Do you prototype the visualization before full implementation?
Yes. For complex visual mechanics, an interactive prototype is often the fastest way to validate hierarchy, interaction, readability, and stakeholder expectations before building the production component.
What deliverables can be handed over to our team?
Depending on scope, the handover can include custom visualization components, transformation utilities, layout generators, interactive prototypes, documented integration points, and modularized D3.js code.