Battle the complexity of analysis with the power of interactive data visualization. Manage workflows more effectively and at lower costs to scale up your business!
Create graphs, flowcharts, and diagrams to improve any workflow you wish! Customized interactive solutions let the users organize and display the data most conveniently. Thanks to this mechanism, users can finally focus on critical metrics, connections between them, and understanding the business logic behind every task.
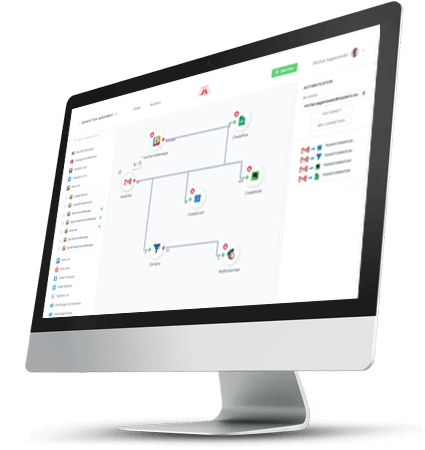
Diagramming, enhanced with backend, can be used to develop API integration solutions that allow users with no programming skills to modify the data. For example, with drag and drop user interface and SDK (Software Development Kit) it is possible to integrate data sources and create workflows without need for any coding. It lets employees focus on product development rather than asking the IT department for the integrations’ customization.
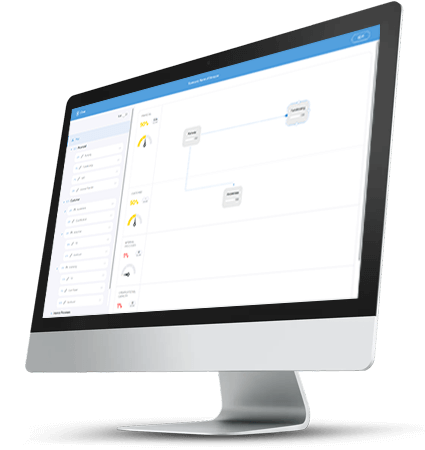
Make the creative processes easy! Enhance custom apps with interactive dashboards containing flow charts, graphs and diagrams to represent relations between the units. For example, suppose you would like to boost employees’ performance. In that case, you can use diagramming to create an app showing how one’s KPIs affect the other department’s goals and how they are, in real-time, completed according to the company’s strategy.
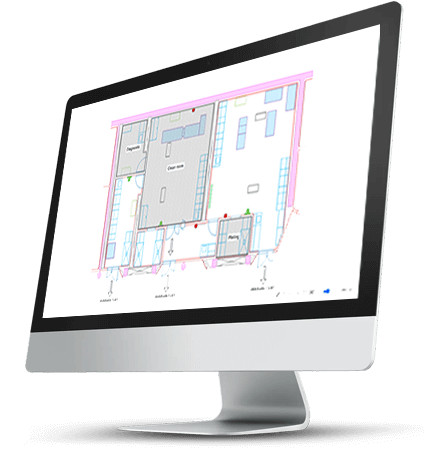
Whether it’s a small project for the office renovation or managing the control status of enormous chemistry laboratories, the diagramming tool will make the whole task easier. With customized templates, you can draw your own facility’s plan with the possibility to assign a function (kitchen, chill room?) or a particular employee responsible for this sector. And you need no particular expertise in this field.
Even a professional data analyst can be fed up with reading rough data without a meaningful story glimpsing in the corner. Operating on data displayed in an entirely non-intuitive way slows down the analyses and leaves employees with the feeling of boredom or even frustration. Instead of spending arduous hours staring at the static report’s charts and struggling to spot any connection, you can boost your data analysis with interactive flowcharts, graphs and diagrams.
How about creating meetings and workshops, managing agile workflows, strategy & research assemblings just through one tool? Such a solution improves users’ collaboration experience, enhances productivity, and leads to better outcomes. It also eliminates the problem of team members feeling tired due to switching between multiple communication channels.
Diagramming solutions enable creating apps that represent the data transparently, allowing users to draw their schemes and ideas that result in process simplification. Whether we are thinking of a tool for performance management, floor planning or developing collaboration spaces, letting users understand the business logic behind every project influences the process immensely.
Where there is any metric to follow, an opportunity to use diagramming possibilities arises. Let’s have a look at the example of laboratory spaces. Thanks to using, for instance, color coding to display the current state of an area, employees can be easily oriented in the inspection statuses. And, in case of any guidelines breaching, react fast and effectively.
Putting a significant value on displaying the data makes it easy to conclude on their basis. By providing the possibility to organize the data and manage process schemes for non-technical people, diagramming helps companies switch between different tasks, saving time and money. And with the right diagramming library, you can develop those apps faster than with the use of alternatives.
Cooperate with professionals who listen to your needs and are willing to dive into your ideas, test the assumptions and validate the concept.
Communicate with developers who will help you not only solve the technical problems but will also understand the business challenges standing behind them.
If you wish, we can help you set up appropriate success criteria to monitor the app’s performance according to the goals you want to achieve.
As we provide diagramming solutions that are meant for improving workflows, it is not a surprise that we value well defined management processes. That is why we developed a repeatable method of software development to reduce the number of delays and potential misunderstandings. It helps us keep communication transparent and deliver high-end products that meet our clients’ expectations.
It’s high time to start our journey! After you submit the query on our Estimate Page, our Business Development Manager will reach out to you as soon as possible. We will schedule a meeting so we can initially discuss your ideas and plan the following steps, which are technical calls and workshops. Of course, it is also the right time to ask us whatever you want!
After ice-breaking, we invite you to the workshops with the correct plan adjusted depending on the phase of your project. The main meetings’ goals are to deepen our understanding of how your product should work, what your needs are, and to draw and test the assumptions. In addition, you will meet our developers and get project timelines, estimates and technological and business recommendations.
Let’s bring your project to life! Guided by our strong motivation, we want to deliver the product as soon as possible. Therefore, we love scrum: working in sprints helps us face this challenge. At the end of each sprint, you get working elements you can test with users. Moreover, you are involved in every app development phase so you’re always up to date and in control over the development process.
Diagramming software lets users create diagrams/charts that present meaningful data and the flow of information. It comes with the gamut of predefined shapes and symbols that can be bonded together to visualize connections between various factors.
Diagramming software, through interactive data visualization, helps users understand the business logic standing behind tasks. Therefore, it is a perfect solution for process management improvement. Moreover, operating on data displayed in an easy to navigate way supports better results tracking. Interactive data visualization clarifies complex systems, provides vizual space to collaborate thus supporting communication among the teams.
Everything depends on your needs! If you would like your software to be easily scalable (so as to have space for further development, for example: broadening the range of data types included), it is recommended to have a look at the bespoke diagramming software. Such software is customized according to your needs, data you would like to insert or the platforms your company uses.
Difference between BPMN and diagramming resides in the idea of interacting with the data. Although BPMN tools can provide a graphical representation of specific business processes, diagramming lets users organize the data and enables interaction with 3rd party tools.
Optimize your workflows by building custom JointJS+ features for creating graphs, flowcharts, and diagrams.
Implement yFiles into your SaaS product, develop custom yFiles features, connect them to GPT, or build something from scratch.
Unlock the hidden potential of data to drive tangible business results – and do it faster than you’d expect.
Haven’t found what you’re looking for? Let’s talk and see how we can help you.