A floorplanner solution that increases employees’ workspace awareness
Nanoramic Laboratories
About the project
We helped our client develop a frontend part of the feature in the workplace organization app based on the “6S methodology” (otherwise known as 5S+ Safety). This system aims to promote and sustain a high level of productivity and safety throughout a workspace. The app aimed to boost employees’ awareness about what areas in the lab look like, where they are precisely situated and what kind of problems might occur in certain places. Its objective also concerned allowing administrators to design the facility’s floor plan and manage the workspace
Our tasks

Frontend development of a floorplanner
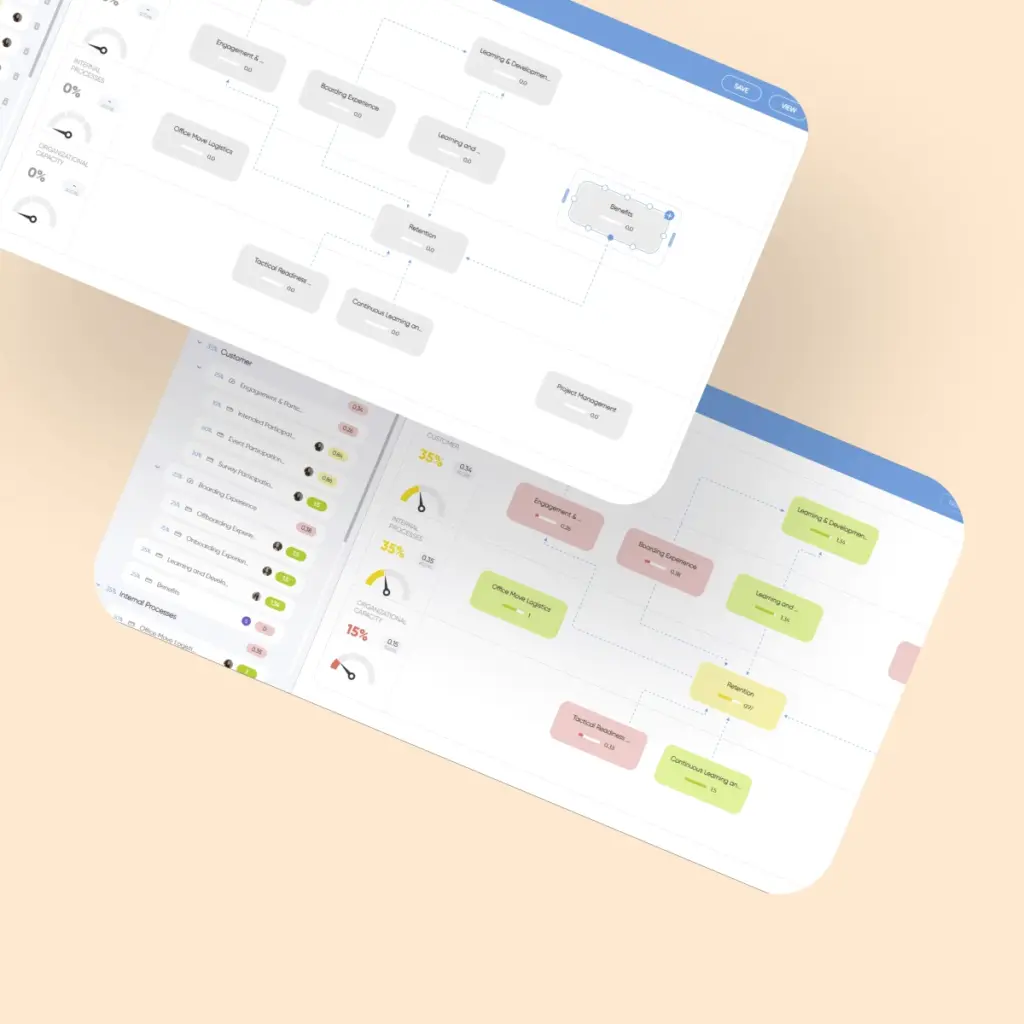
It enabled administrators to draw the facility’s floor plan and draw the data from the ERP software about area assignees and the inspection status of a given area. This plan and information involved were supposed to be displayed in the app in an easy-to-navigate way for all the employees.

Designing the app’s modules that were independent from the Client’s API
Our Client wanted the components displaying the data to be independent from the company’s API due to their sensitivity.

While quantitative results can't be measured at the moment, the end product that Neoteric developed has been successfully implemented in the company's facilities, which has been met with positive reception. The internal stakeholders are particularly impressed with the quality of their deliverables.
Astghik Sargsyan, Product Owner at Nanoramic
Source: Clutch.co
01
Challenges
Lack of a reliable error-detection and monitoring system
Our Client noticed that the administrators encountered an obstacle in checking the areas’ inspection statuses. Particularly in the percentage of their completion, score in a numeric value and spotting wherever any errors occurred. Although the data concerning the inspection status was easily accessible, it was not visually presented and that is why the stakeholders couldn’t understand it clearly.

02
Solutions

Developing a module for floor planner management
Our client already had a solution on their end but wanted to develop it further, which is one reason why Nanoramic approached us. So, after workshops discussing shared vision, we rolled up our sleeves and focused on creating a module that enabled administrators to draw floor plans. Such a feature was supposed to increase workspace awareness and broaden management opportunities.
Devising a segment displaying workspace’s data
And here, the power of data visualization turned out to be invaluable! Thanks to color-coding, employees could easily see if a certain area is ready for acceptance or whether any dangers were detected. The app could illustrate the actual area’s state thus significantly reducing the time needed to check it manually.

Technology we used

JavaScript

Angular

TypeScript
03
Project Results

Administrators can easily manage the company’s processes in a fast and time-saving way
Thanks to using the app to monitor the statuses of areas, the management process became much more convenient and less time-consuming.
Boosting workspace awareness in the company
As everyone in the company can see the current plan of laboratories and monitor if there are any changes, the employees became much more aware of the workspace organization. Moreover, color coding used to enrich data visualization helped employees analyze the data in a more intuitive way.